Emission Visualization System - List of Manufacturers, Suppliers, Companies and Products | IPROS

Emission Visualization System Product List

1~8 item / All 8 items

Displayed results

GreenConnex

Visualize CO2 emissions by product! It is also possible to visualize management issues and on-site challenges in factories.

We would like to introduce 'GreenConnex' that we handle. It visualizes the production equipment and product challenges in factories. It supports efforts to reduce CO2 emissions for each product. In addition to visualizing CO2 emissions, it can also visualize management and on-site challenges in factories. 【Features】 ■ Both on-site staff and managers can check information in real-time ■ Costs related to product manufacturing can be confirmed ■ CO2 emissions for each product (primary data) can be verified with actual measurements ■ Equipment with high energy consumption can be identified ■ Challenges and areas for improvement can be checked in real-time ■ CO2 emissions for each product and their reduction points can be confirmed *For more details, please refer to the related links or feel free to contact us.

  • others
  • Emission Visualization System

Added to bookmarks

Bookmarks list

Bookmark has been removed

Bookmarks list

You can't add any more bookmarks

By registering as a member, you can increase the number of bookmarks you can save and organize them with labels.

Free membership registration

Maintenance-oriented CO₂ visualization service "CASICA"

CO₂ emissions and operational management useful for maintenance planning.

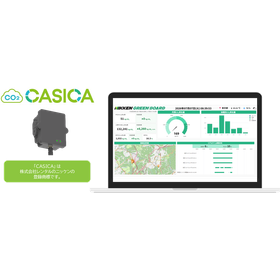
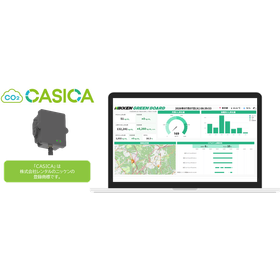
In the maintenance industry and maintenance planning, it is essential to accurately grasp the operational status of equipment and conduct planned maintenance. In particular, managing CO₂ emissions is emphasized in response to environmental regulations and sustainable operations. Inadequate operational management and insufficient understanding of CO₂ emissions can lead to unexpected failures and increased environmental impact. Our service "CASICA" automatically calculates and visualizes CO₂ emissions from construction machinery operational data, supporting the improvement of maintenance planning accuracy. 【Usage Scenarios】 - Planning maintenance based on the operational status of construction machinery - Data collection aimed at achieving CO₂ emission reduction targets - Efficient operational management on-site 【Benefits of Implementation】 - Reduction of downtime through improved accuracy of maintenance planning - Streamlining of CO₂ emission data collection and reporting tasks - Increased productivity and reduced environmental impact through the promotion of digital transformation (DX) and green transformation (GX) on-site.

  • Construction machinery leasing and rental
  • Emission Visualization System

Added to bookmarks

Bookmarks list

Bookmark has been removed

Bookmarks list

You can't add any more bookmarks

By registering as a member, you can increase the number of bookmarks you can save and organize them with labels.

Free membership registration

Agricultural CO₂ Visualization Service "CASICA"

Automatically calculates CO₂ emissions from agricultural machinery operations. Achieving decarbonization and efficiency!

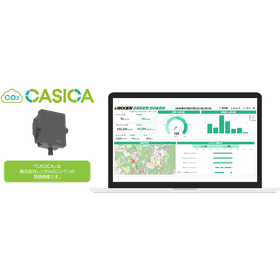
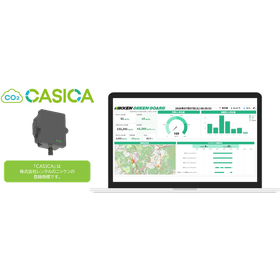
In the agricultural sector, efforts to reduce environmental impact are being demanded. Particularly in the operation of agricultural machinery, understanding and managing CO₂ emissions are emphasized. However, manual aggregation and reporting tasks are burdensome, making efficient operation a challenge. Our service "CASICA" resolves these issues by automatically calculating and visualizing CO₂ emissions simply by installing sensors on agricultural machinery. 【Usage Scenarios】 - Understanding the operational status of agricultural machinery in the field - Streamlining the recording and reporting of CO₂ emissions - Utilizing data to achieve environmental impact reduction targets 【Benefits of Implementation】 - Accurate understanding and management of CO₂ emissions - Reduction of the burden of aggregation and reporting tasks - Promotion of environmental measures while improving operational efficiency

  • Construction machinery leasing and rental
  • Emission Visualization System

Added to bookmarks

Bookmarks list

Bookmark has been removed

Bookmarks list

You can't add any more bookmarks

By registering as a member, you can increase the number of bookmarks you can save and organize them with labels.

Free membership registration

CO₂ Visualization Service 'CASICA' for the Energy Industry

Automatically calculates CO₂ emissions in equipment monitoring. Achieves decarbonization and efficiency.

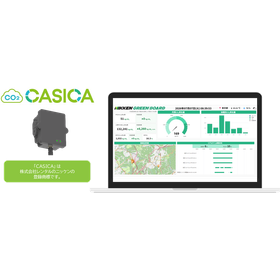
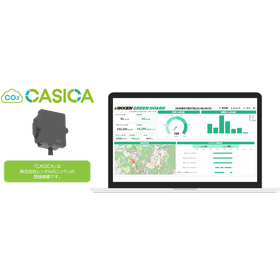
In the energy industry, equipment monitoring requires improvements in operational efficiency and reductions in environmental impact. Particularly for large-scale facilities such as plants and power stations, understanding operational status and accurately calculating associated CO₂ emissions are crucial. Inadequate management can lead to decreased energy efficiency and delays in responding to environmental regulations. CASICA supports the resolution of these issues by automatically calculating and visualizing CO₂ emissions from construction machinery operational data. 【Use Cases】 - Monitoring the operation of equipment such as plants and power stations - Understanding energy consumption and tracking CO₂ emissions - Visualizing environmental impact for each piece of equipment 【Benefits of Implementation】 - Accurate understanding of CO₂ emissions and streamlined reporting processes - Identification of opportunities for improving energy efficiency - Strengthened response to environmental regulations

  • Construction machinery leasing and rental
  • Emission Visualization System

Added to bookmarks

Bookmarks list

Bookmark has been removed

Bookmarks list

You can't add any more bookmarks

By registering as a member, you can increase the number of bookmarks you can save and organize them with labels.

Free membership registration

Logistics CO₂ Visualization Service "CASICA"

We visualize the CO₂ emissions of delivery vehicles to support efficient operations.

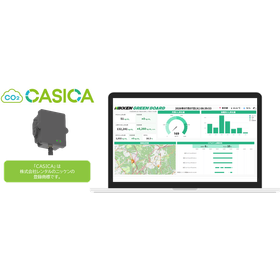
In the logistics industry, there is a demand for reducing CO₂ emissions through the optimization of delivery routes and the management of vehicle operations. Particularly in delivery operations with high fuel consumption, accurately understanding emissions and implementing reduction measures are crucial for both reducing environmental impact and cutting costs. Our service "CASICA" automatically calculates and visualizes CO₂ emissions from vehicle operation data, supporting the resolution of these challenges. 【Usage Scenarios】 - Management of delivery vehicle operations - Understanding fuel consumption - Aggregation and reporting of CO₂ emissions 【Benefits of Implementation】 - Promotion of environmental measures through the visualization of CO₂ emissions - Optimization of delivery routes through the analysis of operation data - Reduction of operational burden through the efficiency of aggregation and reporting tasks

  • Construction machinery leasing and rental
  • Emission Visualization System

Added to bookmarks

Bookmarks list

Bookmark has been removed

Bookmarks list

You can't add any more bookmarks

By registering as a member, you can increase the number of bookmarks you can save and organize them with labels.

Free membership registration

CO₂ Emission Visualization Service 'CASICA' for Forestry

Automatically calculate CO₂ emissions from logging management. Achieve decarbonization and efficiency.

In forestry logging management, reducing environmental impact and improving work efficiency are required. In particular, when using heavy machinery for logging operations, understanding and managing CO₂ emissions is emphasized. Accurate measurement of CO₂ emissions is essential for sustainable forest management and compliance with regulations. Our service "CASICA" automatically calculates and visualizes CO₂ emissions from construction machinery operating data, supporting the resolution of these challenges. 【Usage Scenarios】 - Understanding the operating status of heavy machinery at logging sites - Real-time monitoring of CO₂ emissions - Streamlining work reporting tasks 【Benefits of Implementation】 - Data collection towards achieving decarbonization goals - Increased productivity through promoting DX and GX at the site - Contribution to reducing environmental impact

  • Construction machinery leasing and rental
  • Emission Visualization System

Added to bookmarks

Bookmarks list

Bookmark has been removed

Bookmarks list

You can't add any more bookmarks

By registering as a member, you can increase the number of bookmarks you can save and organize them with labels.

Free membership registration

CO₂ Visualization Service for the Transportation Industry! Location Information "CASICA"

Automatically calculates the CO₂ emissions of vehicles. Achieving decarbonization and efficient vehicle management!

In the transportation industry, there is a demand for balancing vehicle operational efficiency with reducing environmental impact. In particular, understanding and reducing CO₂ emissions is considered an important aspect of corporate social responsibility. However, accurately calculating CO₂ emissions for each vehicle and monitoring operational conditions in real-time presents a challenge that requires significant effort and time. Our service "CASICA" addresses these issues by automatically calculating and visualizing CO₂ emissions simply by installing sensors on vehicles, while also centrally managing operational status and location information. 【Usage Scenarios】 - Management of CO₂ emissions for long-distance transport vehicles - Improvement of fuel efficiency through delivery route optimization - Understanding the operational status and CO₂ emissions of the entire fleet of company vehicles 【Benefits of Implementation】 - Accurate understanding of CO₂ emissions and setting of reduction targets - Reduction of fuel costs through improved operational efficiency - Streamlining vehicle management tasks and reducing the burden of reporting duties

  • Construction machinery leasing and rental
  • Emission Visualization System

Added to bookmarks

Bookmarks list

Bookmark has been removed

Bookmarks list

You can't add any more bookmarks

By registering as a member, you can increase the number of bookmarks you can save and organize them with labels.

Free membership registration

【警備向け】CO₂可視化サービス「CASICA」

巡回業務のCO₂排出量を見える化し、効率化を支援します。

警備業界では、広範囲な巡回業務における効率化と環境負荷低減が求められています。特に、移動手段やルートの最適化は、CO₂排出量削減に直結する重要な課題です。しかし、現状の巡回ルートや稼働状況の把握が難しく、効果的な改善策の立案が困難な場合があります。当サービス「CASICA」は、警備車両や担当者の稼働データを活用し、CO₂排出量を自動算定・見える化することで、これらの課題解決を支援します。 【活用シーン】 ・警備車両の稼働状況とCO₂排出量の把握 ・巡回ルートの効率化によるCO₂排出量削減 ・業務報告におけるCO₂排出量データの活用 【導入の効果】 ・巡回業務のCO₂排出量削減 ・業務効率の向上 ・環境報告へのデータ活用

  • Construction machinery leasing and rental
  • Emission Visualization System

Added to bookmarks

Bookmarks list

Bookmark has been removed

Bookmarks list

You can't add any more bookmarks

By registering as a member, you can increase the number of bookmarks you can save and organize them with labels.

Free membership registration